My post about writing documentation for your house surprisingly ended up on the front page of Hacker News for the better part of 48 hours, ending up with 722 points and 319 comments at the time of this post. This was in and of itself very exciting for me, and it was also fun to see the traffic impact of that rank on my website. In this post, we’ll look at some of the analytics I have, just as another data point among many [1, 2, 3, 4, 5, 6, 7, 8, 9, 10, 11, 12, and more] for the power of HN.
If there’s anything to take away from that long list of references, it’s that small bloggers like me find such an event so anomalous that we all want to make a new post about it.
Analytics tool
While my site used to have Google Analytics, I removed it back April 2021 because it felt bloated and bad for privacy. I have simply not had analytics since then. That is, until my post hit the front page and I wanted to know what was happening!
I host this site with Netlify (on their free tier). So, I was super glad to see that Netlify Analytics keeps a backlog of 30 days of history, meaning that even though I didn’t have analytics enabled before it hit the front page, I could still retroactively see what the impact of HN was on traffic. In addition, Netlify Analytics are server-side, not client-side, so hopefully the results are a more accurate, complete picture of traffic (they do not use sampling).
$19 later and I had all the basics I wanted to know and share with you.
Bandwidth used
Let’s start with the total bandwidth used. This was one of the first indicators something was happening, because I got an email that I’ve used up over half my quota of the Netlify free tier’s total bandwidth (100 GB). Over the last 7 days, I used a whopping 85 GB of bandwidth, the vast majority of which was serving this single post, with its total page size of 258.5 kB (209.7 kB of which is served from my domain).
Here’s a day-by-day breakdown.
| Date | Bandwidth Used (MB) |
|---|---|
| 25 Nov 2023 | 49 |
| 26 Nov 2023 | 40 |
| 27 Nov 2023 | 34 |
| 28 Nov 2023 | 18700 |
| 29 Nov 2023 | 39400 |
| 30 Nov 2023 | 19800 |
| 01 Dec 2023 | 5100 |
That is about 83 GB while the post was on the front page.
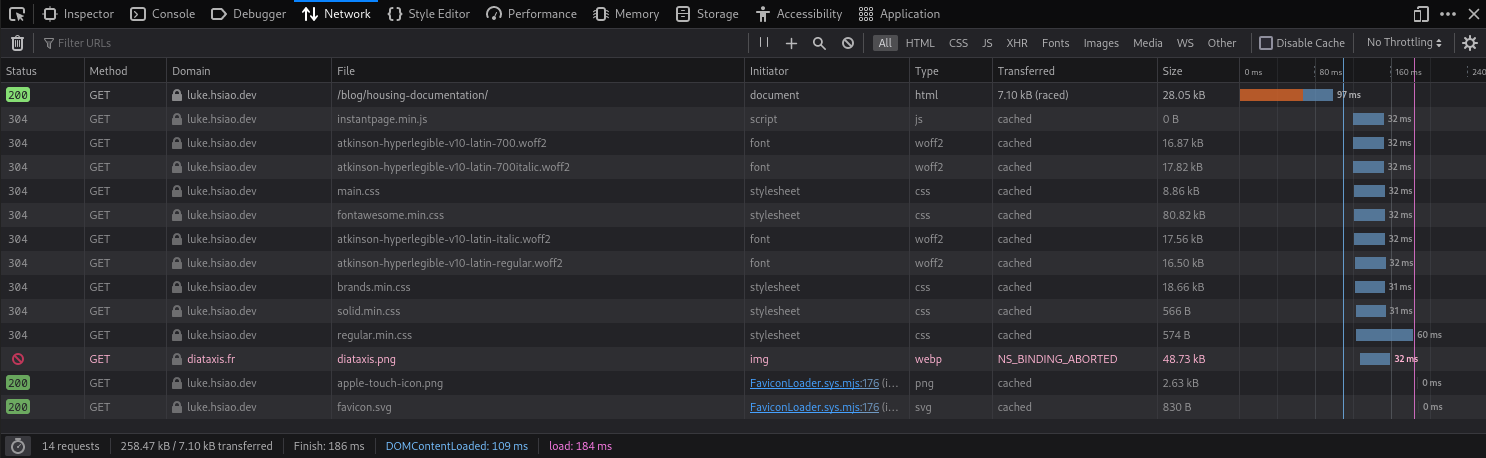
The vast majority of the page size is from me directly serving fonts (Atkinson Hyperlegible and FontAwesome), rather than using something like Google Fonts for performance and privacy reasons. The Diátaxis image is not served from my domain.
Also note that most of these static assets are cached after the first visit. As shown in the screenshot, if loaded before, only 7.1 kB end up transferred.
Page views
Here’s the most fun graph. If you were to ask me “How many page views do you get from being on the front page of Hacker News?”, I would’ve guessed 10k, which is fairly close to some of those other data points referenced in the opening paragraph.
So, when I looked to see these page view stats (again, which I haven’t seen since 2021) I was shocked for two reasons. First, the baseline of ~100-200 page view was much higher than I would’ve expected (I’d have guessed in the 10s). Second, over the past 7 days, the page views were as follows (just capturing the raw numbers from the graph).
| Date | Page Views |
|---|---|
| 25 Nov 2023 | 123 |
| 26 Nov 2023 | 155 |
| 27 Nov 2023 | 113 |
| 28 Nov 2023 | 37513 |
| 29 Nov 2023 | 73910 |
| 30 Nov 2023 | 40253 |
| 01 Dec 2023 | 7680 |
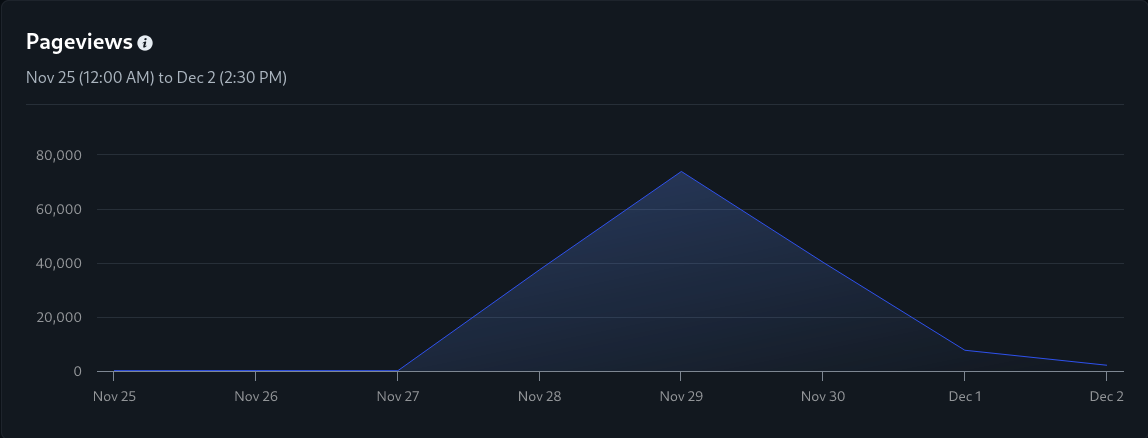
In other words, about 160k page views in aggregate.
Unique visitors
Here is the same breakdown, but for unique visitors (defined by Netlify as different IP addresses).
| Date | Page Views |
|---|---|
| 25 Nov 2023 | 76 |
| 26 Nov 2023 | 68 |
| 27 Nov 2023 | 73 |
| 28 Nov 2023 | 22530 |
| 29 Nov 2023 | 44409 |
| 30 Nov 2023 | 25322 |
| 01 Dec 2023 | 5290 |
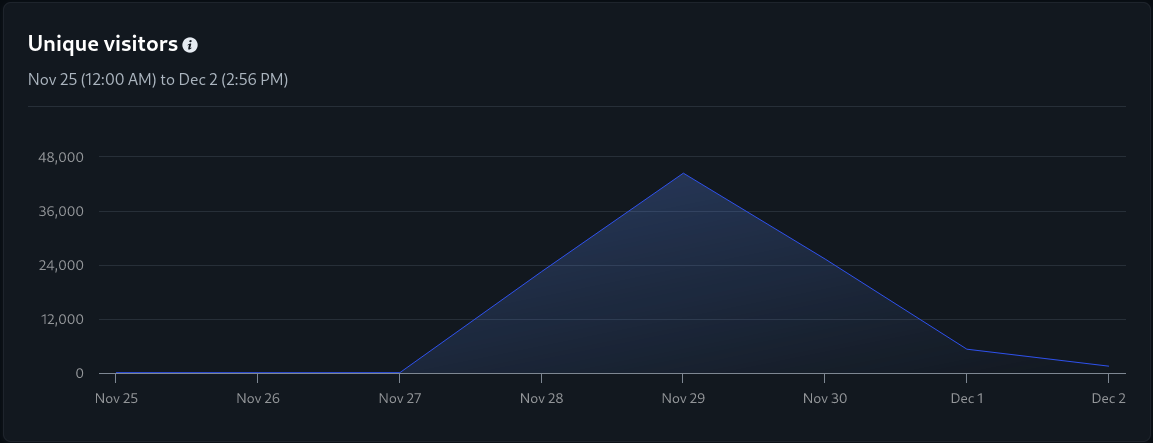
In other words, about 97.6k unique visitors in aggregate.
Top locations
Here are the top 7 countries where the traffic came from over the last 7 days.
| Location | Page Views |
|---|---|
| United States | 85617 |
| Germany | 10936 |
| United Kingdom | 8675 |
| Canada | 6524 |
| France | 5011 |
| Australia | 4270 |
| The Netherlands | 3376 |
Besides expecting the U.S. to be the top, I don’t have enough analytics experience to have made a guess about the other 6 spots.
Top pages
These are the pages of my site that have had the most page views in the past 7 days. I assume the vast majority of all of these clicks came from readers hitting the blog post, and then exploring a little bit.
| Page | Page Views |
|---|---|
| /blog/housing-documentation/ | 152567 |
| / | 4984 |
| /blog/ | 1278 |
| /collection/ | 676 |
| /blog/favorite-software-2023/ | 494 |
| /blog/software-releases/ | 234 |
| /blog/page/2/ | 229 |
| /blog/framework-13-amd/ | 205 |
| /blog/home-warranties/ | 144 |
| /blog/page/3/ | 138 |
| /blog/fastapi-axum/ | 135 |
| /blog/excellence-through-iteration/ | 121 |
| /blog/freshman-success/ | 112 |
| /blog/cable-lacing/ | 88 |
| /blog/mumble-for-synchronous-communication/ | 82 |
It’s interesting that only 3.3% of people hitting the blog ended up hitting the next most visited page (the homepage). Another observation: I checked with my company’s analytics and based on that, only about 110 referrals to the company home page came from my domain. So, that’s only about 0.072% of the blog post visitors that went through those two hops.
It’s also personally interesting to see what posts appeared popular. I largely just write to jot my own thoughts down, with no particular audience in mind and very minimal editing or polish. In this case, with the Hacker News crowd, I’m glad my collection of links and posts about software bubbled up.
Top sources
The top 6 sources that generated traffic to my site are reported as the following.
| Source | Referrals |
|---|---|
| Direct traffic | 146587 |
| hckrnews.com | 1281 |
| google.co.uk | 1227 |
| google.com | 964 |
| news.ycombinator.com | 864 |
| mail.google.com | 459 |
This is surprising because I’m confident that the vast majority of traffic came from news.ycombinator.com.
But, if other HN users are like me, it turns out the Referrer header is not set.
Here are headers I see when my browser (Firefox with uBlock Origin) clicks on the link on HN.
GET /blog/housing-documentation/ HTTP/2
Host: luke.hsiao.dev
User-Agent: Mozilla/5.0 (X11; Linux x86_64; rv:120.0) Gecko/20100101 Firefox/120.0
Accept: text/html,application/xhtml+xml,application/xml;q=0.9,image/avif,image/webp,*/*;q=0.8
Accept-Language: en-US,en;q=0.5
Accept-Encoding: gzip, deflate, br
Connection: keep-alive
Upgrade-Insecure-Requests: 1
Sec-Fetch-Dest: document
Sec-Fetch-Mode: navigate
Sec-Fetch-Site: cross-site
Sec-Fetch-User: ?1
If-None-Match: "43bb06c3234f55c2420aa062eb5bab3d-ssl-df"
So, this is a good tip that if you depend on that header for analytics (e.g., some marketing campaign), you might not get it. Other blogs in the opening paragraph appear to have more correlated numbers here, so perhaps behavior has changed over time.
Backlinks
Another fun thing to look at is backlinks. The vast majority of these were a variety of odd HN-aggregating spam sites which I don’t list here. These sites appear to take the top N articles of a day and spam identical content on many odd domains.
However, I also had a handful of real backlinks, which were fun to peruse. Here’s a sample.
- Project Hinzelmann: Building a Household RAG App, Keven R. Kuhl
- A very cool application of generative AI for housing documentation.
- Documenting your Household, Ben Neise
- A follow-up to my post, which goes above and beyond! Adds a bunch of requirements you might consider, as well as a whole lot of good concrete ideas that I didn’t think about (e.g., travel docs, christmas card list, insurance details, etc.).
- well well well, jessamyn
- Came across and old three-ring binder that had house documentation that would’ve saved a lot of work if found 18 months earlier. Motivated by reading the blog to write the story down.
- Home maintenance, Just Jeepin’
- Linked to this excellent xkcd along with a call out to my post. Lots of fun commentary in the thread as well.
- How do you do personal knowledge management?, Jonathan Carroll
- Had documented a bunch of stuff already, but it wasn’t centralized. Reading my post was a reminder that he could pull everything together.
- GitLab and Caddy, Grumpy Metal Guy
- Looking to build a home manual after reading the post, and his post goes through their implementation with GitLab and Caddy.
- The Good and Bad of Remote Work, Alex Hyett
- Post featured in a “picks of the week” list, where the author is considering starting a home wiki as a result
- mastodon post, JP Hastings-Spital
- Plans on building a Hugo template for this purpose, and is searching for existing markup languages to help.
- Document your house, Mark Rainey
- A nice follow-on post that links to mine but also an interesting book called “How Buildings Learn”.
- Writing Documentation for your House, Gregory Wexler
- Links to my post to bring it to the attention of the Home Assistant community.
- Now, Hisam Fahri
- Links to my post for why they are working on writing “life documentation”.
- Read The Fabulous Manual (LinkedIn), William Cuthrell,
- Used my post as an example of when documentation matters to people outside of tech/software.
- Organize, Oinam
- Appears more interested in the Diataxis framework I linked, but also complements my post.
- TLDR 2023-11-30, TLDR
- Appears in a list of selected posts, no commentary, but this is a fairly popular newsletter.
- 2023 log, Daniel Mihalov
- Appears in a list of selected posts, no commentary, but a checkmark “rating”.
- TikTok, una máquina de sacar dinero a los usuarios (LinkedIn), Carlos Molina del Rio
- Featured in a list of selected posts, no commentary, but fun since it’s in another language.
- Autumn 2023 in review, Xila
- Featured in a list of selected posts, with no commentary.
- 2023.12.03: 各种链接, Owen Young
- Featured in a list of selected posts, with some questions. Chinese blog.
- The Changelog - v0.4.0, Scott Carvalho
- Featured in a list of selected posts, with no commentary.
While most of these are essentially just bookmarks (much like I do in collection), some others add personal stories or expand upon the idea in really great ways. It’s also fun to see it being referenced in many languages. It’s seeing things like this that make the Internet feel fun.
Conclusion
What a fun ride! That submission is now my highest voted submission on HN by far. With my simple static site, Netlify was able to serve all the traffic without any downtime or me needing to pay extra to scale up or out (though I almost had to pay for more bandwidth).
I’m curious to see in the coming weeks if that HN post results in a different baseline of these stats, but I suspect I will return to similar levels as before. Either way, it was fun knowing some people read these musings. As a result of that post, I also received some kind emails, some followers/stars on GitHub, some LinkedIn requests, and even some texts from college friends that recognized my name.
Updates
2023-12-16
In case you’re curious how traffic played out after a couple of weeks, it went about as expected.
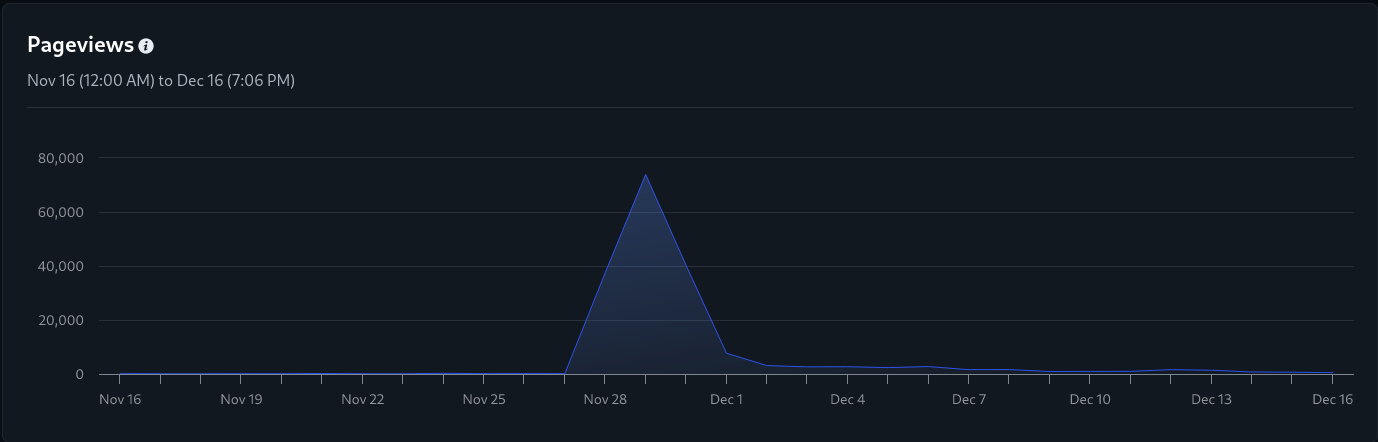
My page views before the spike ranged from about 80 to 200 views. There was a sharp drop, and then a slow decline down to about 650 views yesterday.
2024-07-06
Added a new section highlighting some fun backlinks.
2025-10-08
This blog is no longer served on Netlify, instead it’s served with Cloudflare Pages. I switched because at the time, it was possible to rack up an enormous bill if you exceeded the free tier bandwidth, and there was no way to control that. Netlify has since added support for a hard limit since Sept 4, 2025, but I have not felt any reason to switch back.